Chapter 3: Marriage Preparation & Marital Transitions

3. Couples: Married or Not
Learning Outcomes
At the end of this chapter you will be able to do the following.
Define and identify marrieds, nonmarrieds, and cohabitors
Identify pros and cons of each group
Explain the legal aspects of marriage
Compare benefits for marrieds and nonmarrieds
A couple is simply a pair of people who identify themselves in terms of belonging together, trusting one another, and having a unique relationship, separate from all others. A “We” is close to the same thing, yet it focuses on the relationship as an entity in itself. A “We,” as shown in Figure 1, is a married couple but can also include cohabiters or other intimate non-married couple arrangements. This is a relationship that is not as intimately connected to any other relationships at the same profound level as they are connected to one another.
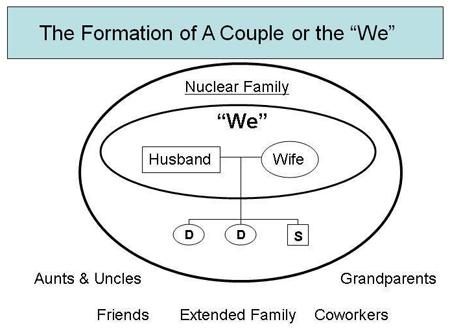
Figure 1: The “We” as it Relates to a Married Couple.
Here is a metaphor: a “We” is much like a vehicle (relationship) that two people purchased together. Both have to put in maintenance. Both have to care for it and treat it in such a way that it lasts for a long time. Sometimes, spouses or partners attack the other in such a way that the other is harmed or damaged in their trust. A “We” is the social and emotional boundary a couple establishes when they decide to become a couple. This boundary includes only the two partners. It purposely excludes the children, extended family, co-workers, and friends. Most couples who establish a strong marital bond have successfully distinguished themselves as a “We” and partially disengaged from the existing relationships of child, grandchild, best friends, etc. This does not mean that parents, relatives, and other friends are cut off, but rather that a new exclusive intimacy is established and only includes an individual and their spouse. (Wallerstein & Blakeslee, 1995)
This also means making certain things into spouse-only issues which are the decisions, advice, information, and discussion that are held exclusively between partners and intentionally NOT between other family and friends. This might include types of birth control, how to run a budget, sexual techniques and practices, who might be at fault in an argument, etc. If a couple marries in their late 20’s, then they have a life-long history of intimate help-seeking and advice-giving relationships with others. These may continue as long as the help-seeking behavior doesn’t violate the intimate agreements of confidentiality for each spouse or partner. It is crucial to form the “We” so that married couples avoid potentially damaging intrusions of family and friends into their new marriage. In essence, the couple chooses to create a boundary around their relationship and only particular information, influence, and connection is permitted to enter the system (them as a couple) or exit the system.
Marriage is a legal union between a man and a woman as recognized by the local and/or national government. Internationally, and in the United States and many other countries, a man and another man or a woman and another woman can be legally recognized as a married couple. What are typical marriage structures? The World-wide culturally preferred marriage type today is monogamy. Monogamy is the marriage form permitting only one spouse at a time. Almost all who have married in the U.S. have done so monogamously since the original colonies in the 1600s. Monogamy implies a 1:1 relationship and is typically desired both by married couples and by opposite and same-sex cohabiters.
Cohabitation is the moving in together of two partners without going through the formalities of legal marriage. Although similar in form and function, cohabitating couples live differently in many significant day-to-day aspects when compared to married couples. There are many different reasons that people choose to cohabit. Some couples choose to cohabit without any future goal of marriage. Some couples see living together as a natural progression towards marriage. Many cohabiting couples do eventually choose to marry, but their risk of divorce is higher than among couples that never cohabited (Bramlett & Mosher, 2002). Cohabitation will be discussed more below, but it has been increasingly popular over the past few decades. For the years between 2006 and 2010, nearly half (48%) of all women cohabited before marriage (up from 43% in 2002 and 34% in 1995). Additionally, in the United States, cohabitation for women has increased in duration (from 13 months in 1995 to 22 months in 2006-2010) (NCHS, 2013).
Polygamy (Polygamy, n.d.) is a marriage form permitting more than one spouse at the same time. Polygyny (Polygyny, n.d.) is a marriage form permitting more than one wife at the same time and is the most common form of polygamy in the world’s history. Polygyny is still common and legal in many African, Middle-Eastern, Muslim, and Indian nations. It was a deep part of China’s history and prior to World War II it was common for a Chinese man to have multiple wives and many children.
Figure 2: Current Legal Status of Polygamy around the World:
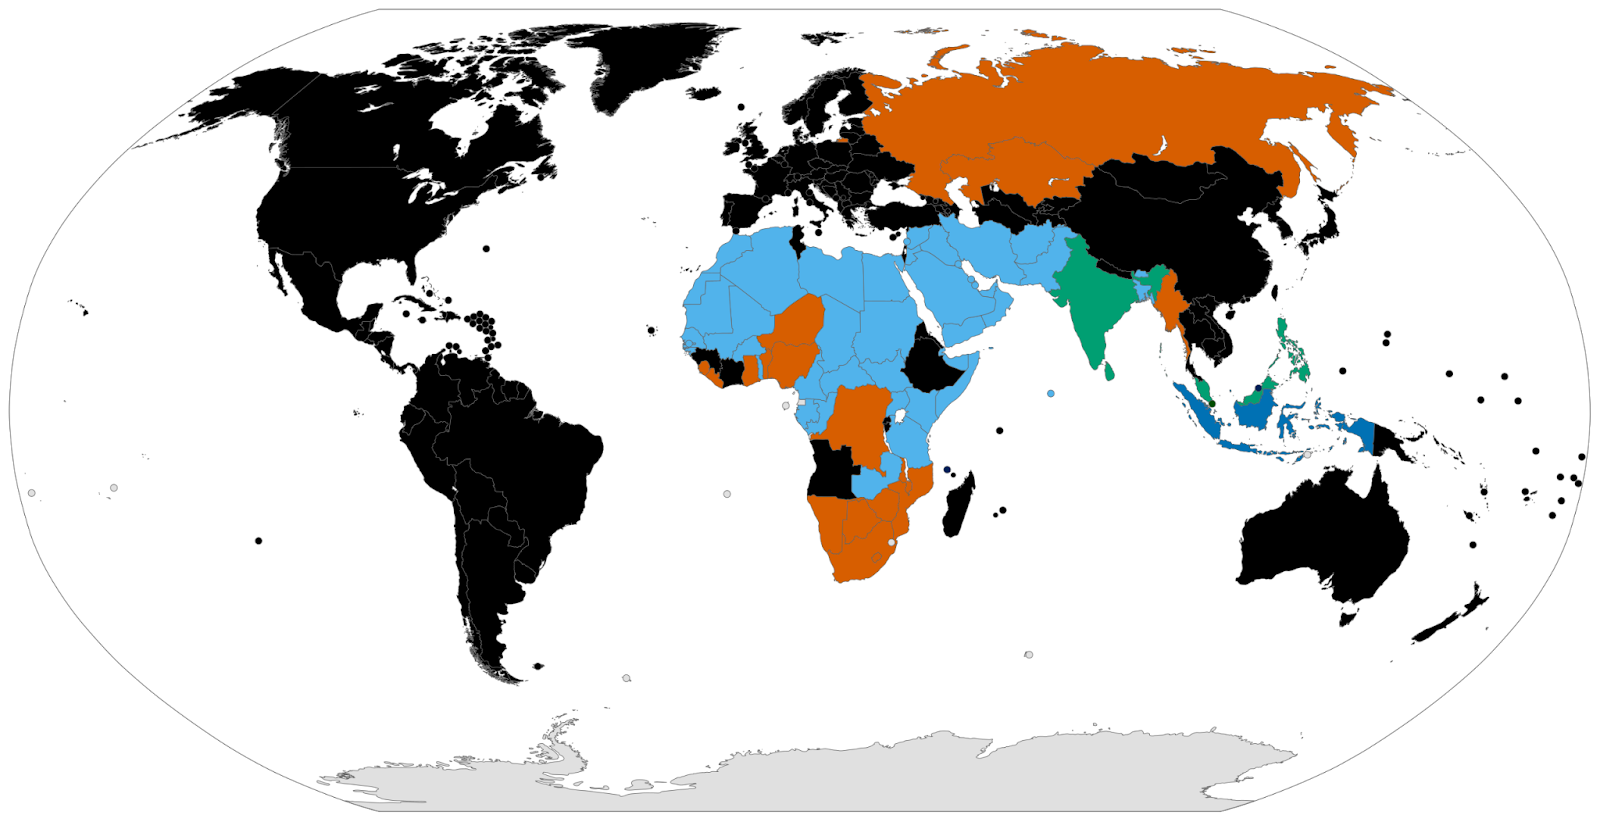
Polyandry (Polyandry, n.d.) is a marriage form permitting more than one husband at the same time. This is historically and currently rare, and, if or when it was practiced, it often includes the marriage of one wife to a set of brothers with all husbands having sexual access to the wife (this was found in Tibet, Nepal, Northern India, and Central African cultures). Polyandry has also been found among some Pacific Island cultures and among the pre-Taliban Afghans.
What if a person marries, divorces, marries, divorces, etc.? Serial Monogamy or Serial Polygamy is the process of establishing intimate marriage or cohabiting relationships that eventually dissolve and are followed by another intimate marriage or cohabiting relationship, that eventually dissolve, etc. in a series. Thus polygamists have simultaneous multiple spouses while serial monogamists or serial polygamists have multiple spouses in a sequence of relationships. Millions of U.S. adults will experience serial marriages and divorces. Many marry then divorce, yet still want to be married again. Many others who suffered through their parents’ unhealthy marriages and divorces also want to marry, knowing firsthand the possibility of having a difficult marriage.
LEGALITY OF MARRIAGE
Marriages are usually performed by local (foreign) civil or religious officials. In the U.S., states have power when it comes to allowing marriage. Centuries ago, fathers, clan or kinship leaders, religious leaders, and community members had the rights to marry, which are now claimed by the state or nation. Almost every year, there are about two legally sanctioned state marriages in the U.S. for every one legally sanctioned state divorce decree.
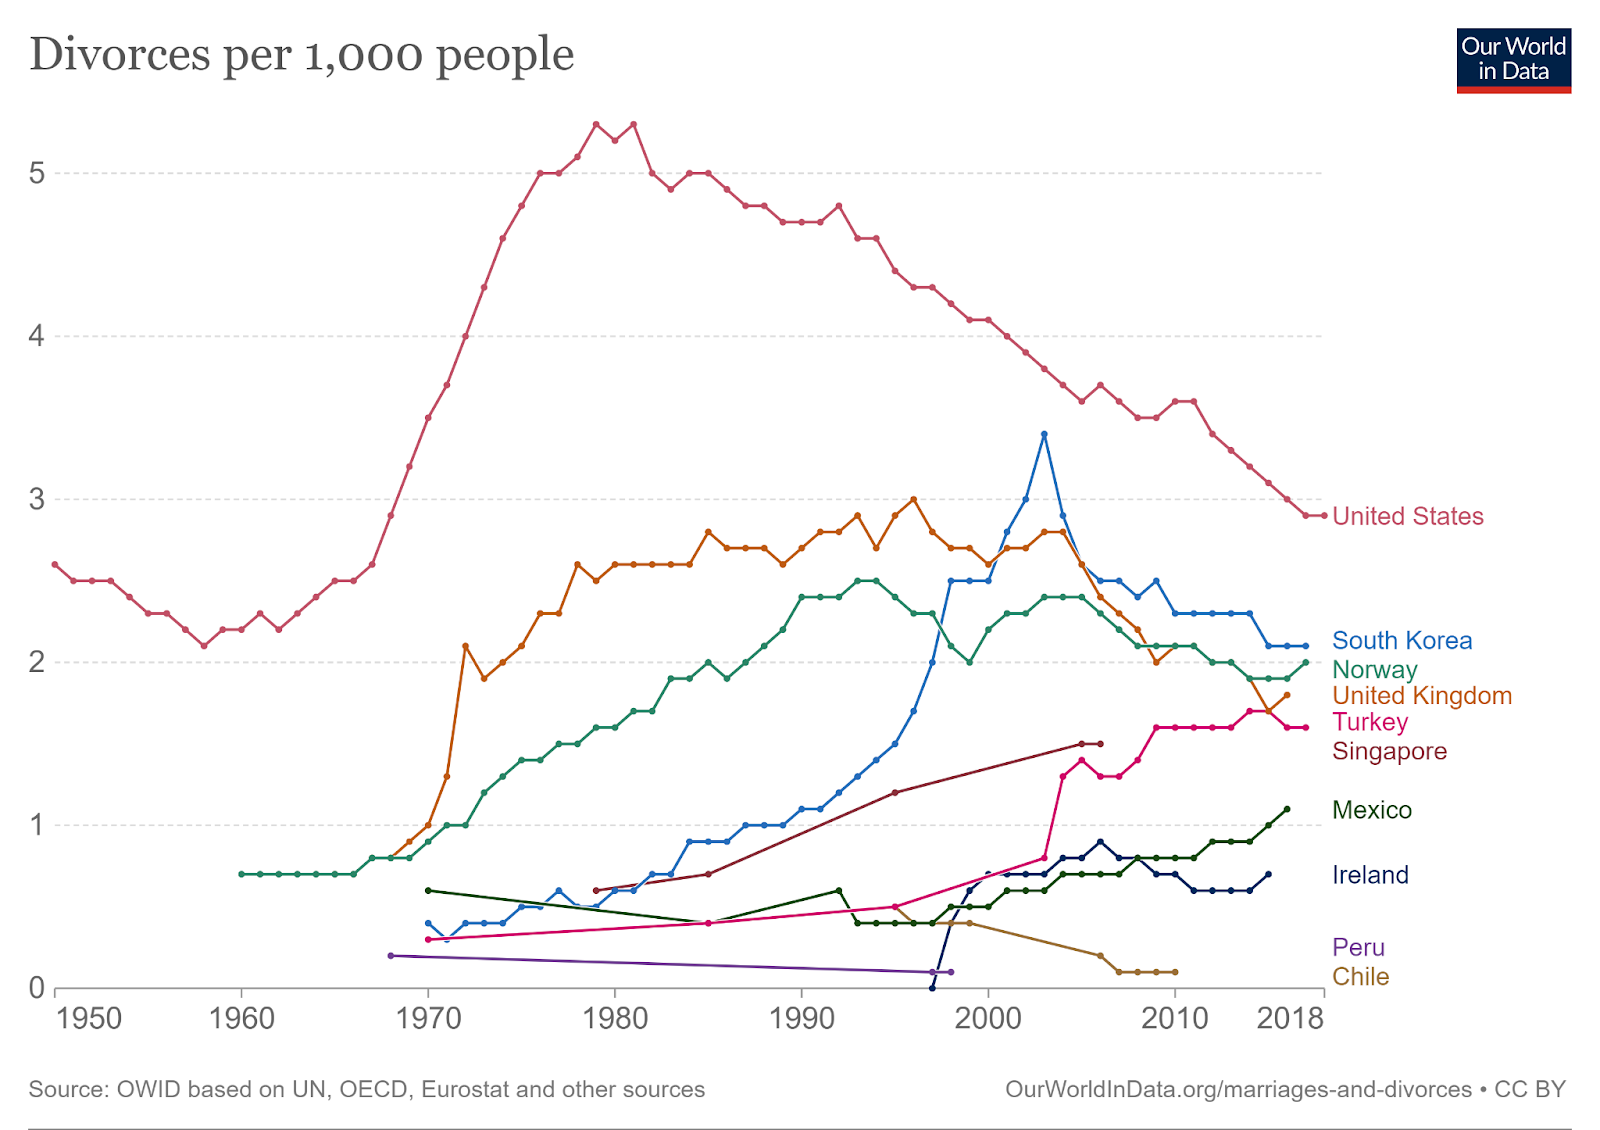
In Figure 3 below you can see just how many legal marriages in the U.S. were granted per divorce for the years 1960-2005. These numbers are presented as a ratio (number of marriages/number of divorces per year). In 1960, there were almost four marriages per divorce. As the rate of divorce increased, we see that there were about two marriages per one divorce. Notice that since the late 1990s the ratio is increasing slightly because divorces are down.
Based on surveys of exactly how many people have ever been divorced in their lifetimes, most will tell you it is closer to 43% in the U.S.’s worst divorce decade ever (1980s) (U.S. Census Bureau, n.d.-a).
The trends for divorce vary substantially from country to country.
In the chart the US stands out as a bit of an outlier, with consistently higher divorce rates than most other countries, but also an earlier ‘peak’. South Korea had a much later ‘peak’, with divorce rates continuing to rise until the early 2000s. In other countries –such as Mexico and Turkey– divorces continue to rise. As the OECD Family Database notes, between 1995 and 2017 (or the nearest available estimate), divorce rates increased in 18 OECD countries, but fell in 12 others.
The pattern of rising divorce rates, followed by a plateau or fall in some countries (particularly richer countries) might be partially explained by the differences in divorce rates across cohorts, and the delay in marriage we see in younger couples today.
In the chart here we show the crude divorce rate; the number of divorces per 1,000 people in the country.
When we zoom out and look at the large-scale picture at the global or regional level since the 1970s, we see an overall increase in divorce rates. The UN in its overview of global marriage patterns notes that there is a general upward trend: “at the world level, the proportion of adults aged 35-39 who are divorced or separated has doubled, passing from 2% in the 1970s to 4% in the 2000s (United Nations, n.d.).”
But, when we look more closely at the data we can also see that this misses two key insights: there are notable differences between countries; and it fails to capture the pattern of these changes in the period from the 1990s to today.
Figure 3: Divorces per 1,000 People (Ortiz-Ospina & Roser, n.d.)
The U.S. Census Bureau conducts annual surveys of the U.S. population and publishes them as the Current Population Surveys. Table 1 represents U.S. family types as of October 1, 2008. You will notice that marrieds comprised the largest number of family types in 2008. Single never-marrieds are the second largest type and include roughly 6.8 million cohabiters.
The U.S. graphical trend of actual numbers in millions of family types. It shows that the single largest type of family in the U.S. has always been marrieds then never-marrieds. The divorced category overtook the widowed category in the 1970s and has been higher ever since. Why are the trends upward? Simple: these are numbers and not rates nor percentages. The population has grown and therefore the population size has been steadily increasing.
Figure 4. United States Ratio of Marriages per Divorces 1960-2005. (U.S. Census Bureau, 2008b, p. 77)
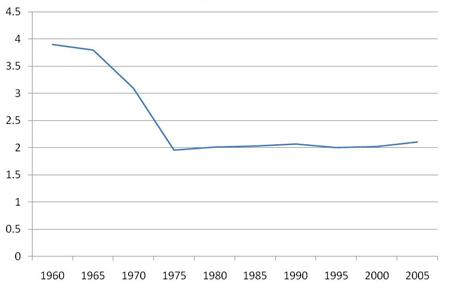
Table 1. U.S. Family Types, 2008. (U.S. Census Bureau, 2008c) | ||
Types | Numbers | Percentage |
Married | 123,671,000 | 52 |
Widowed | 14,314,000 | 6 |
Divorced | 23,346,000 | 10 |
Separated | 5,183,000 | 2 |
Never Married-Single | 71,479,000 | 30 |
Total Families 15 and over | 237,993,000 | 100 |
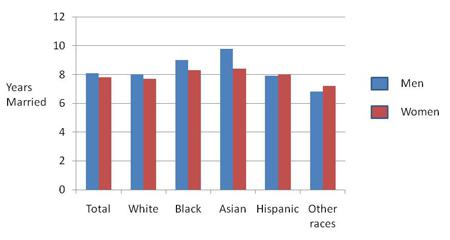
Robert and Jeanette Lauer are a husband-wife team who study commitment and endurance of married couples. They have identified 29 factors among couples who had been together for 15 years or more. They found that both husbands and wives reported as their number 1 and 2 factors that “My spouse is my best friend” and “I like my spouse as a person.” (U.S. Census Bureau, 2008a) The Lauers also studied the levels of commitment couples had to their marriage. The couples reported that they were in fact committed to and supportive of not only their own marriage, but to marriage as an institution.
Irreconcilable differences are common to marriage and the basic strategy to deal with them is to negotiate as much as is possible, accept the irresolvable differences, and finally live happily with them. Keeping a positive outlook on your marriage is essential. As was mentioned above, as long as a couple is married they are technically at risk of divorce. However, not all divorce risks are created equally. Newly married couples (1-10 years) have a great deal of adjustment to work through, especially during the first 36 months. They have new boundaries and relationships to establish. They have to get to know one another and negotiate agreements about the who, what, why, and how of their day-to-day lives together. The longer they stay together, the lower their risks of divorce.
According to the National Conference of U.S. State Legislatures, two young people may marry at 18 without parental consent in 49 states (Lauer & Lauer, 1986). In Mississippi individuals have to be at least 21 years old to marry without their parent’s permission. The following table represents the legal age to marry with and without parental consent in different countries around the world.
Individuals who marry in their teens (even 17, 18, & 19) have much higher rates of marital dissolution. Some argue that this might be because the individual continues to change up until about age 25-26 when they are fully psychologically mature. Some who marry in their teens actually outgrow one another, including their loss of attraction that stems from their changed tastes. When marital data is collected by the U.S. Census Bureau, it often shows that those marrying in their teen years have the highest rates of having ever been divorced.
As mentioned above, most unwed mothers end up marrying the biological father of their baby. These marriages often end in divorce more than marriages for non-pregnant newlyweds. The existence of children at the time of the wedding is often associated with higher divorce rates. Family Scientists have borrowed from the physics literature a concept called entropy which is roughly defined as the principle that matter tends to decay and reduce, toward its simplest parts. For example, a new car, if parked in a field and ignored, would eventually decay and rot. A planted garden, if neglected, would be overrun with weeds, pests, and yield low if any crop.
Marital Entropy is the principle that if a marriage does not receive preventative maintenance it will move towards decay and break down. Couples who take ownership of their marriage and who realize that marriage is not a state of constant bliss (nothing really is) and that it often requires much work, will experience more stability and strength when they nurture their marriage. These couples care for their marriage, acknowledging the propensity relationships have to decay if unattended.
Many individuals struggle to completely surrender their single status. They mentally remain on the marriage market in case someone better than their current spouse comes along. Norval Glenn (1991) argued that many individuals see marriage as a temporary state while they keep an eye open for someone better. More honest vows would be as long as we both shall love or as long as no one better comes along (page 268). Glenn gets at the core of the cultural values associated with risks of divorcing (National Conference of State Legislatures, n.d.).
A positive outlook for your marriage as a rewarding and enjoyable relationship is a realistic outlook. Some couples worry about being labeled naïve if they express the joys and rewards their marriage brings to their lives. It is important to be hopeful and positive on the quality and duration of one's marriage. Along with websites matching people to one another, seminars, and websites promoting proactive and preventative factors to marriage success are available to the general public (Glenn, 1991).
Mate selection requires time, understanding oneself, waiting until 20 or older, and finding foremost a good friend in a future spouse. These factors all contribute to marriage success. Keep in mind that very few people marry someone they meet as strangers. Most end up marrying someone they find through their social networks such as work, campus, dorms, frats and sororities, friends of friends, and other relationship-based connections.
There also continues to be a trend of delaying first marriage until later in life. In 2005, the U.S. median age at marriage was about 27 years for men (Washington DC was 29.9 years and Utah was 24.6) and 25.5 for women (Washington DC was 29.8 years and 22.1 for Utah) (U.S. Census Bureau, n.d.-c).
In other countries, the average age one marries can vary greatly.
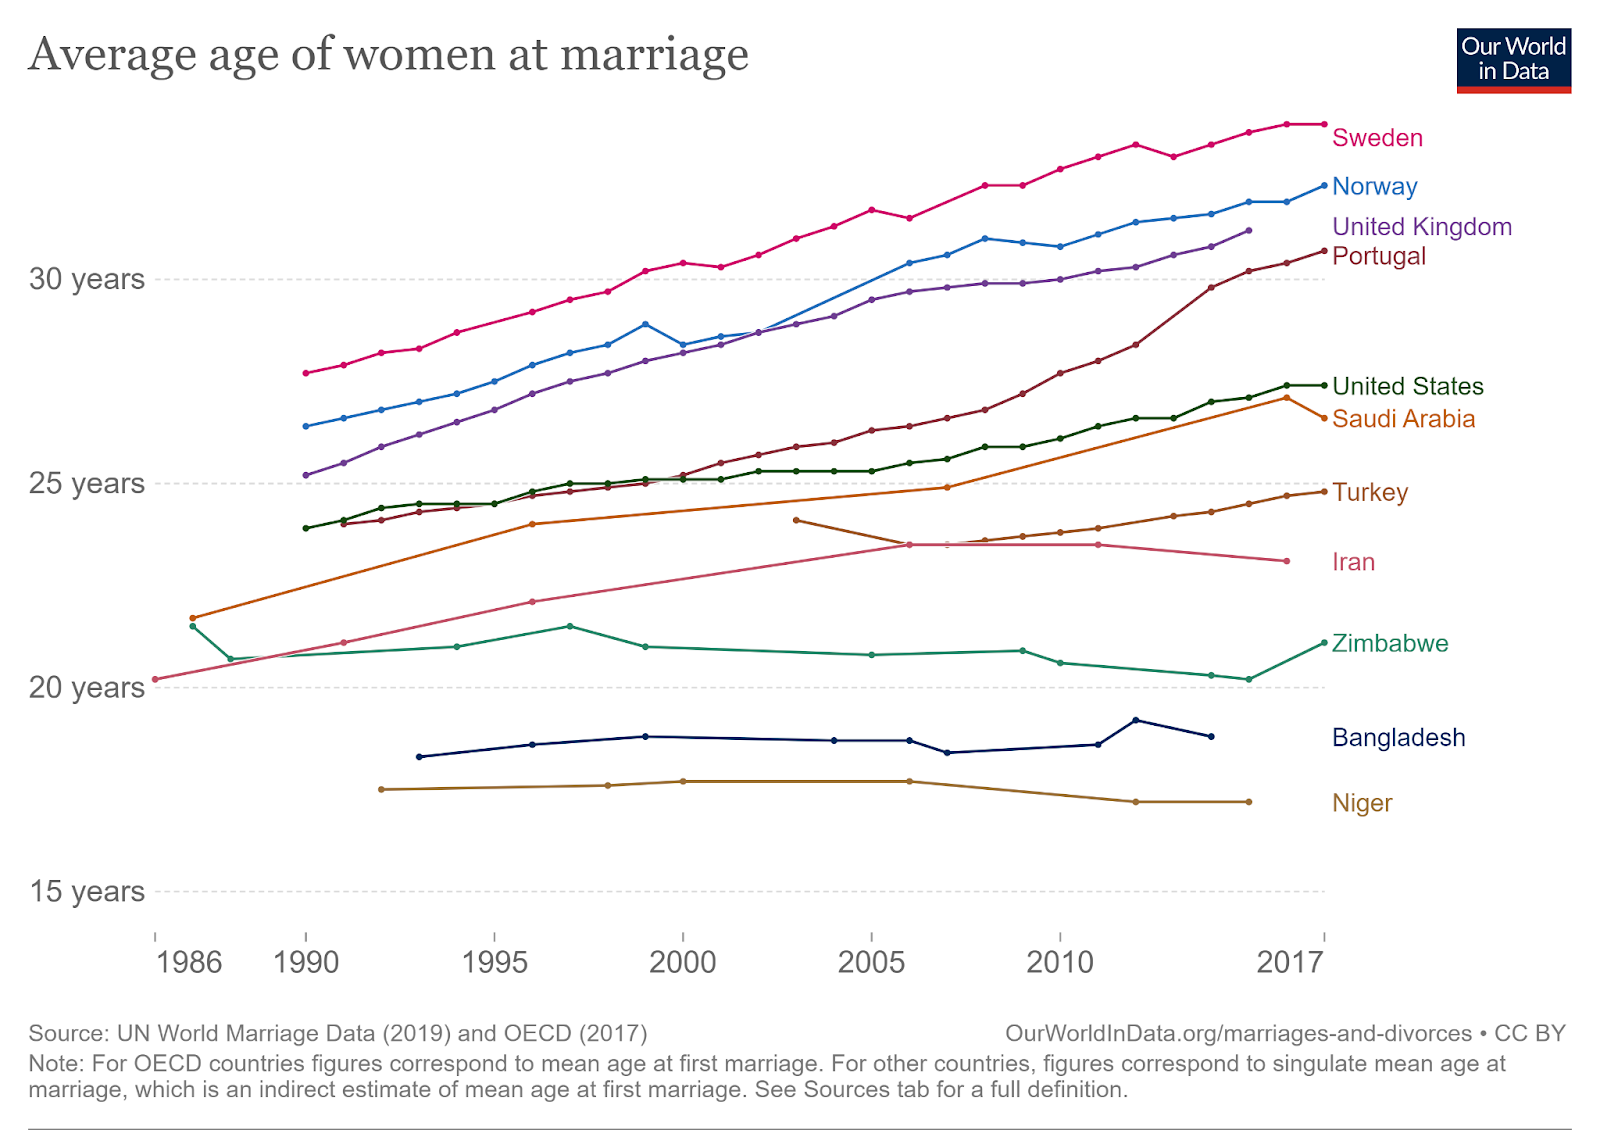
Figure 5: (Average Age of Women at Marriage, n.d.)
Marriage is very popular, in part because it does offer many rewards that unmarried people don’t enjoy. A sociologist named Linda Waite co-wrote a book with Maggie Gallagher called The Case For Marriage: Why Married People Are Happier, Healthier, and Better Off Financially (2001, Doubleday). As its title implies, this book summarizes basic trends that have been found among married people for decades. Marriage has become socially controversial in part because of the intense political efforts to legalize marriage for same-sex couples. Regardless of your moral position on the issue of same-sex marriage, you can see the political quest for it as an indicator of just how rewarding it is to be legally a “married couple.”
There are numerous studies and books on the benefits of marriage to married individuals. Table 2 lists ten categories of these known benefits for you to consider.
Table 2. Ten Benefits of Being Married in Contrast to Being Single.
Better physical and emotional health
More wealth and income
Positive social status
More and safer sex
Life-long continuity of intimate relationships
Safer circumstances for children
Longer life expectancy
Lower odds of being crime victims
Enhanced legal and insurance rights and benefits (tax, medical, and inheritance)
Higher self-reported happiness
Cohabitation
Cohabitation has been studied extensively for the last three decades, especially in contrast between cohabiting and married couples. Clear findings consistently show that cohabiting and marriage are very different experiences. Those who cohabit have less clarity on the intention and direction of the relationship than do marrieds. Further, people who cohabit, then later marry, are more likely to divorce than those who never cohabited. In 2010 the U.S. Center for Disease Control reported that cohabitation is very common in our day:
“Among both men and women aged 15-44 who had ever cohabited and or married, the largest proportion cohabited before their first marriage. Approximately 28% of men and women cohabited before their first marriage, whereas 23% of women and 18% of men married without ever cohabiting. About 15% of men and women had only cohabited (without ever marrying), and less than seven percent of men and women first cohabited after their first marriages ended (Goodwin et al., 2010).”
This report also stated that some of the cohabitation relationships dissolved while others transitioned to marriage. Less educated cohabiters cohabited longer while college-graduated cohabiters transitioned to marriage more.
How long do cohabiting relationships last?
Cohabitation tends to last longer in European countries than in the United States. Half of cohabiting relationships in the U. S. end within a year; only 10 percent last more than 5 years. These short-term cohabiting relationships are more characteristic of people in their early 20s. Many of these couples eventually marry. Those who cohabit for more than five years tend to be older and more committed to the relationship.
There are a number of different ways of measuring cohabitation. The U.S. Census Bureau reported about 6,209,000 U.S. Unmarried-Partner households in 2007. Since a household in this case contains at least two persons we can derive 6,209,000 x 2= 12,418,000 unmarried adults sharing households. These data were extrapolated from the American Community Survey, and the types of unmarried-partner households are identified in Figure 7.
Figure 7. Number of Unmarried-Partner Households in the United States, 2007. (Goodwin et al., 2010)
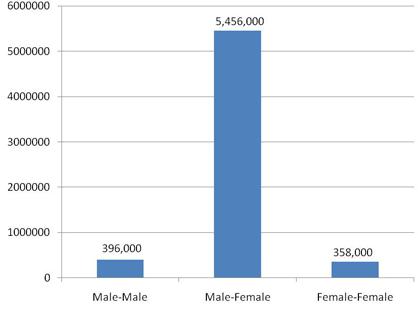
Although this survey did not identify sexual orientation, many find these to be good indicators of heterosexual partner pairs (about 5.456 million) and homosexual partners (about 754,000). Keep in mind that there are millions of gays, lesbians, and heterosexuals who do not have a partner living in the same household. David Popenoe reported on attitudes about cohabitation and said that most teenagers report that living together before marrying is a good idea and that 50% of U.S. women ages 19-44 had cohabited at some point in their lives. He also compared U.S. couples to couples in other Western nations and found that in the U.S. about 7.6% of all couples cohabited, much lower than most other countries in Western Europe (U.S. Census Bureau, n.d.-b, p. 63).
The increase in cohabitation is the result of the two changes that we discussed above: fewer people are choosing to marry and those people who do get married tend to do so when they are older, and often live with their partner before getting married. In the UK, for example, 85% of people who get married cohabited first (Ortiz-Ospina & Roser, n.d.).
Long-run data on the share of people living in cohabitation across countries is not available, but some related data points are: In particular, the proportion of births outside marriage provide a relevant proxy measure, allowing comparisons across countries and time; if more unmarried people are having children, it suggests that more people are entering long-term cohabiting relationships without first getting married. It isn’t a perfect proxy –as we’ll see below, rates of single parenting have also changed, meaning that rates of births outside marriage will not match perfectly with cohabitation rates– but it provides some information regarding the direction of change.
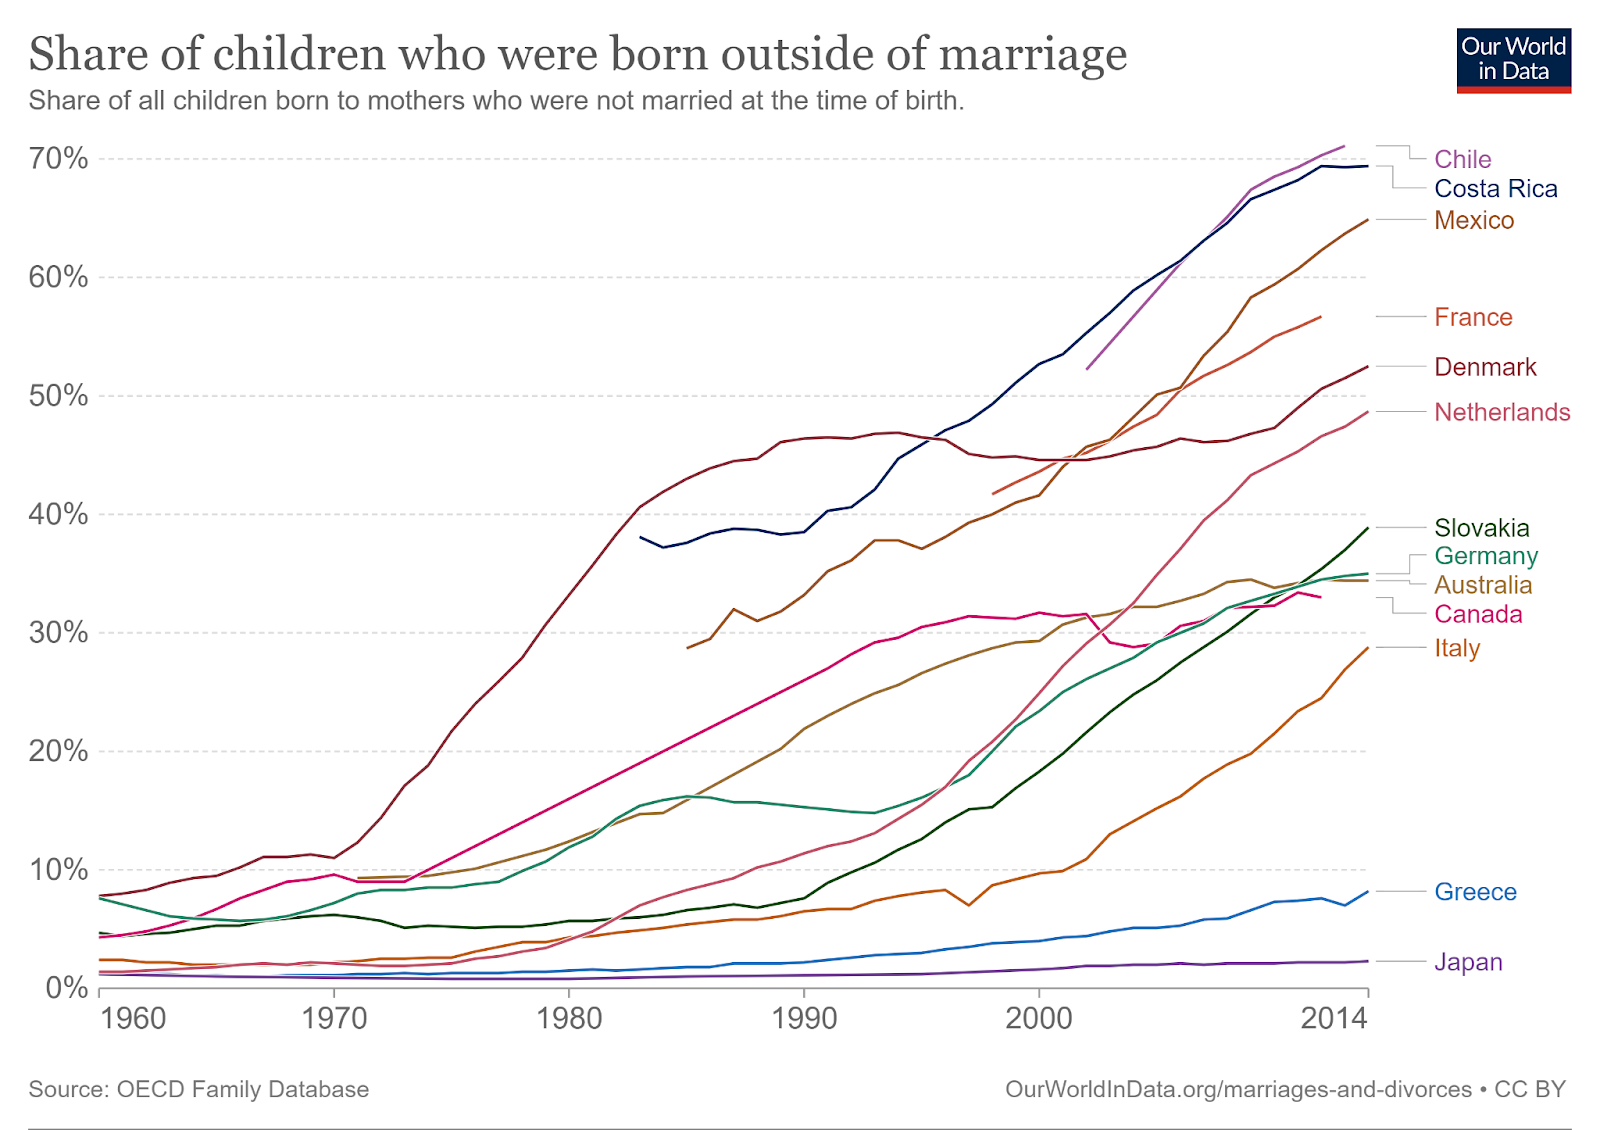
As we can see, the share of children born outside of marriage has increased substantially in almost all OECD countries in recent decades. The exception is Japan, where there has been only a very minor increase.
In 1970, most OECD countries saw less than 10% of children born outside of marriage. In 2014, the share had increased to more than 20% in most countries, and to more than half in some.
The trend is not restricted to very rich countries. In Mexico and Costa Rica, for example, the increase has been very large, and today the majority of children are born to unmarried parents.
Not all cohabitation experiences are the same. There are people who cohabit more than once. Serial cohabiters are persons who have a series of cohabiting relationships over the course of time. These persons tend to be poorer and less educated in the U.S. When or if these persons ever marry, their divorce risks are over two times higher than those who never cohabited in a series (Popenoe, 2009).
A recent study on U.S. cohabitation and marriage was published online by the National Center for Health Statistics using Wave 6 data (Lichter & Qian, 2008). They surveyed 15-44 year old singles in 2002 and assessed their relationship patterns. They found that only nine percent were currently cohabiting and that less than 30% were likely to still be cohabiting after five years together (compared to 78% of marrieds still together after five years). Part of this is because many of the cohabiters eventually married while some ended the relationship. In fact, among first-time cohabiters, 65% eventually married. This report also stated that 28% had cohabited before their first marriage.
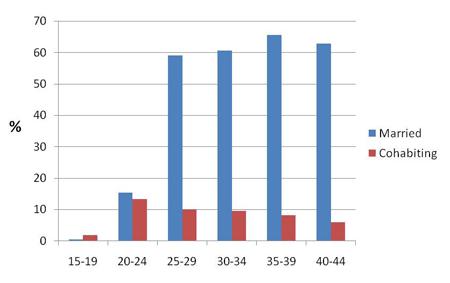
Based on data presented in this report, you can see in Figures 7 (women) and 8 (men) patterns of marriage and cohabitation among those who were in either of these relationships (does not include singles). One quickly begins to see patterns of higher marriage and lower cohabitation across the age categories. The older people were much more likely to be married than the younger ones. One can also see that cohabitation was more common among younger groups. This, again, confirms the belief among younger people in the U.S. that cohabitation is normal or expected.
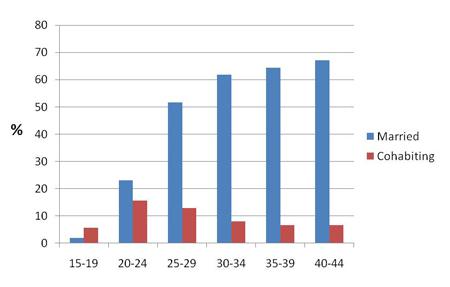
Those cohabiters who get pregnant often have two choices: marry or break up. Breaking up is often more common than marrying (Goodwin et al., 2010). Another recent study reported on lower commitment levels among cohabiting couples, and that the less religious were more likely to cohabit than marry (Lichter & Qian, 2008). Lichter and Qian (2008) reported that cohabiting couples’ intentions to marry plays into their relationship outcome. In other words, if they move in together thinking they will marry someday, it may lead to a longer relationship as long as both have the same intention and neither changes their mind.
Courtship and Engagement
(Brigham Young University-Idaho Psychology Department, n.d.)
Most people will marry in their lifetime. In the majority of countries, 80% of men and women have been married by the age of 49 (United Nations, 2013). Despite how common marriage remains, it has undergone some interesting shifts in recent times. Around the world, people are tending to get married later in life or, increasingly, not at all. People in more developed countries (e.g., Nordic and Western Europe), for instance, marry later in life—at an average age of 30 years. This is very different from, for example, the economically developing country of Afghanistan, which has one of the lowest average-age statistics for marriage—at 20.2 years (United Nations, 2013). Another shift seen around the world is a gender gap in terms of age when people get married. In every country, men marry later than women. Since the 1970s, the average age of marriage has increased for both women and men.
As illustrated, the courtship process can vary greatly around the world. So too can an engagement—a formal agreement to get married. Some of these differences are small, such as on which hand an engagement ring is worn. In many countries, it is worn on the left, but in Russia, Germany, Norway, and India, women wear their ring on their right. There are also more overt differences, such as who makes the proposal. In India and Pakistan, it is not uncommon for the family of the groom to propose to the family of the bride, with little to no involvement from the bride and groom themselves. In most Western industrialized countries, it is traditional for the male to propose to the female.
Benefits of Marriage
There are known benefits to being married and in a long-term relationship rather than being single, divorced, or cohabiting. Table 3 shows health benefits from the cohabitation and marriage study of the National Survey of Family Growth. Better mental and physical health with better medical insurance coverage prove to be crucial qualities for married people. As far as children are concerned, having better care and better adult outcomes are crucial factors.
Table 3. Health Benefits Known to be an Advantage among Married Persons in the U.S (Stanley et al., 2004).
Generally better mental and physical health outcomes
Longer lives
Higher rates of health insurance coverage
Lower prevalence of cardiovascular disease
Better health and well-being of children
Children born to unmarried mothers are at greater risk for poverty, teen childbearing, poor school achievement, and marital disruption in adulthood than children born to married mothers.
There are also known financial benefits when comparing marrieds to non-marrieds. More wealth accumulation, higher assets, and higher monthly income are consistent among marrieds. Figure 9 shows the annual earnings of married individuals compared to single men and single women. The first thing you notice is that marrieds have consistently higher annual incomes. In 2007 specifically, marrieds had $28,231 more income than single men and $42,293 more than single women. The difference is even more pronounced if both incomes are taken into consideration for dual income marrieds (i.e., in 2007 dual income couples had $86,435 which is $42,077 higher than single men and $56,139 more than single women).
Figure 9. Annual Income from 1990-2007 in 2007 Constant Dollars Comparing Marrieds to Single Men and Single Women (Goodwin et al., 2010).
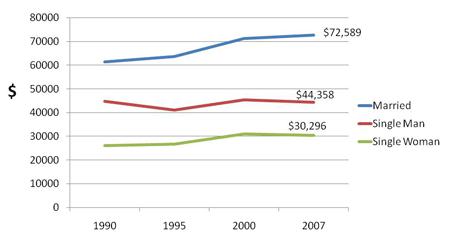
Image 9 summarizes the known benefits to marrieds over non-marrieds that have been established through numerous studies over the last three decades. Married people are safer and less prone to get into trouble than others. There is a buffering effect that accompanies having a life-long devoted spouse who helps deflect stress and hardships on a daily basis. Thus, some of the health benefits of longer life, less suicide, more stable health coverage, and less illness and addiction. Also, marrieds have more social support, more continuity in long-term relationships, and especially more closeness for men in intimate family relationships. Husbands are less likely to abuse and be violent toward their wives than are boyfriends and partners. Married people have clear life-long goals and tend to buy homes, invest, and plan for retirement more than others. The government and military recognize spouses and reward them with tax breaks, benefits, and other sources of coverage and support more than others. In later life, many elderly report that their family relationships are very supportive and important to them. Studies show that the elderly enjoy their human investment in their children and grandchildren which yields emotional and social rewards throughout their golden years.
Known Benefits Enjoyed by Married Couples in Comparison to Non-Married Persons
Less likely to become victims of crime
Less likely to commit crimes
Less addiction
Fewer accidents (especially among men)
Less suicide
Better stress management because spouse is a buffer to life’s stresses
More social and emotional support (less loneliness)
More intimate connections to family members
Long-term continuity in family relationships of children, in-laws, grandchildren, etc.
Lower risk of domestic violence for women
Longer life expectancies
More and better self-rated sex
More emotional and financial security (for both spouses)
Less uncertainty about direction of life and goals
More cost-effective to live in married versus single circumstances
Tax deductions
More military benefits
More accumulated belongings and investments
More medical benefits
More legal rights
References
Average age of women at marriage. (n.d.). Our World in Data. https://ourworldindata.org/grapher/age-at-marriage-women
Bramlett, M., & Mosher, W. (2002). Cohabitation, Marriage, Divorce, and Remarriage in the United States (Vol. 22). Department of Health and Human Services, CDC, National Center for Health Statistics. https://www.cdc.gov/nchs/data/series/sr_23/sr23_022.pdf
Brigham Young University-Idaho Psychology Department. (n.d.). 9.3 Psychosocial Growth in Emerging Adulthood. In Developmental Psychology. Brigham Young University - Idaho. Retrieved November 14, 2023, from https://www.google.com/url?q=https://books.byui.edu/developmental_psychology/93_psychosocial_growth_in_emerging_adulthood&sa=D&source=docs&ust=1699991239517907&usg=AOvVaw0dOvbpE7I8pP_H7W1BY2is
Glenn, N. D. (1991). The Recent Trend in Marital Success in the United States. Journal of Marriage and the Family, 53(2), 261–270. https://doi.org/10.2307/352897
Goodwin, P., Mosher, W., & Chandra, A. (2010). Marriage and Cohabitation in the United States: A Statistical Portrait Based on Cycle 6 (2002) of the National Survey of Family Growth. National Center for Health Statistics. https://www.cdc.gov/nchs/data/series/sr_23/sr23_028.pdf
Lauer, J. C., & Lauer, R. H. (1986). ’Til death do us part: A study and guide to long-term marriage. Harrington Park Press.
Lichter, D. T., & Qian, Z. (2008). Serial Cohabitation and the Marital Life Course. Journal of Marriage and Family, 70(4), 861–878. https://doi.org/10.1111/j.1741-3737.2008.00532.x
National Conference of State Legislatures. (n.d.). Resources and Tools for Legislators and Staff. NCSL. https://www.ncsl.org/
NCHS. (2013, April 4). Trends in Premarital Cohabitation. NCHS: A Blog of the National Center for Health Statistics. https://blogs.cdc.gov/nchs/2013/04/04/1459/
Ortiz-Ospina, E., & Roser, M. (n.d.). Marriages and Divorces. Our World in Data. https://ourworldindata.org/marriages-and-divorces
Polyandry. (n.d.). Wikipedia. Retrieved September 12, 2023, from https://en.wikipedia.org/wiki/Polyandry
Polygamy. (n.d.). Wikipedia. Retrieved September 19, 2023, from https://en.wikipedia.org/wiki/Polygamy
Polygyny. (n.d.). Wikipedia. https://en.wikipedia.org/wiki/Polygyny
Popenoe, D. (2009). Cohabitation, Marriage, and Child Wellbeing: A Cross-National Perspective. 46, 429–436.
Stanley, S. M., Whitton, S. W., & Markman, H. J. (2004). Maybe I Do: Interpersonal Commitment and Premarital or Nonmarital Cohabitation. Journal of Family Issues, 25(4), 496–519. https://doi.org/10.1177/0192513X03257797
U.S. Census Bureau. (n.d.-a). 2004 Detailed Tables. U.S. Census Bureau. http://www.census.gov/population/www/socdemo/marr-div/2004detailed_tables.html
U.S. Census Bureau. (n.d.-b). Table 63. Unmarried-Partner Households by Region and Sex of Partners: 2007. U.S. Census Bureau. Retrieved March 17, 2010, from http://www.census.gov/compendia/statab/2010/tables/10s0063.pdf
U.S. Census Bureau. (n.d.-c). Table MS-1. Marital Status of the Population 15 Years Old and Over, by Sex and Race: 1950 to Present. U.S. Census Bureau. Retrieved March 30, 2009, from http://www.census.gov/
U.S. Census Bureau. (2008a). Population, 2008. U.S. Census Bureau. http://www.census.gov/population/www/socdemo/hh-fam/cps2008.html
U.S. Census Bureau. (2008b). Table 77, Section 2. U.S. Census Bureau. http://www.census.gov/compendia/statab/2008/2008edition.html
U.S. Census Bureau. (2008c). Table A1. Marital Status of People 15 Years and Over, by Age, Sex, Personal Earnings, Race, and Hispanic Origin. U.S. Census Bureau. http://www.census.gov/population/www/socdemo/hh-fam/cps2008.html
Wallerstein, J., & Blakeslee, S. (1995). The Good Marriage. Warner Pub.

This content is provided to you freely by BYU-I Books.
Access it online or download it at https://books.byui.edu/faml_160_readings/chapter_3_marriage_preparation__marital_transitions.